EvolvePlus Blog
New release of EvolvePlus Cloud Dashboard
We are thrilled to unveil the release of ePortal Version 4 – the latest iteration of the EvolvePlus Cloud Dashboard. This innovative platform meticulously analyses people counter data obtained from a variety of sensors, including Overhead, Wireless, and USB. The footfall analytics derived from this data offer valuable insights into peak visitor traffic, venue occupancy, staffing needs, and optimal bathroom cleaning schedules.
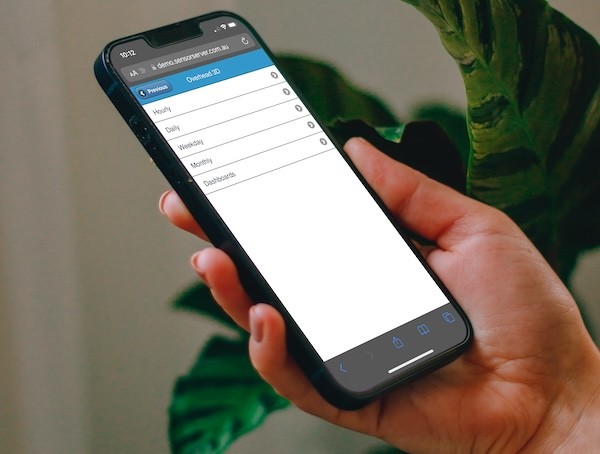
Version 4 marks the ongoing evolution of the EvolvePlus Cloud Dashboard, featuring simplified menus, enhanced mobile optimization, and an expanded array of new reports and charts. Explore the future of analytics with ePortal Version 4 and gain unparalleled insights into your facilities.
The following are some of the new features and enhancements available in Version 4.
Simplified Menu
The ePortal application features a new simplified menu so that all functions are delivered from the initial "ePortal Menu" for improved navigation on mobile devices.

Overhead 3D People Counter Enhancements
New: Daily Overhead 3D Sensor Line Report By Location within Hour Range
Multiple locations can now be selected as part of the report criteria, as well as the specific hour range (e.g. 9 to 17 will only include counts from 9 am to 5:59 pm)
New: Hourly Overhead 3D Sensor Line Report between 8 am and 9:59 pm
This is similar to the existing Hourly report except that it only displays columns from 8 am to 9 pm, providing a less cluttered report display.
New: Hour of the Day Overhead 3D Sensor Chart
This chart displays the total count of each hour of the day across the specified date range. You can also choose the hour range to include in the chart (e.g. 9 to 17 will only include counts from 9 am to 5:59 pm)
Wireless LoRaWAN People Counter Enhancements
New: Daily LoRaWAN Sensor Report By Position
This is the same as the existing Daily LoRaWAN Totals by Location report, except that you choose a single location and then choose from a list of positions for the location.
New: Hourly LoRaWAN Grid Report Between 8 am and 9 pm
This is similar to the existing Hourly report except that it only displays columns from 8 am to 9 pm, providing a less cluttered report display.
New: Hour of the Day Chart for LoRaWAN By Location
This chart displays the total count of each hour of the day across the specified date range. You can also choose the hour range to include in the chart (e.g. 9 to 17 will only include counts from 9 am to 5:59 pm)
Enhanced: Administration->Monitoring->Latest LoRaWAN People Counter Records
This report displays a log of the latest LoRaWAN People Counter entries saved to the database, which is ideal for checking the current battery levels.
An enhancement has been developed to include the following fields:
- Location
- Position
Wireless RF People Counter Reports
We have redeveloped the Wireless RF reports & charts, with the redevelopment items now displayed in their own section of the menu, providing improved performance and accuracy.
A key feature is that each sensor will have a timezone preconfigured in ePortal so that it no longer relies on the sensor_timezone from the user's login. It also means that multiple locations from different timezones can be on the same report (e.g. display visitor counts for Melbourne and Perth on a single report).
These reports are found in the menu People Counters -> Wireless RF (New Timezone)
More Information
Throughout 2024, we will be systematically introducing the update to our EvolvePlus Cloyd customers. Should you have any questions or need additional information about the update, please don't hesitate to reach out to EvolvePlus. We are here to assist you and ensure a smooth transition to the latest and most advanced features of Version 4.


